Advertising platform analytics
Facebook, Instagram, Google, YouTube, LinkedIn… all advertising platforms become really attractive, and above all useful, when we take into account all the analytical data that can be obtained on an individual platform or by using its analytical tools. The information they provide is like the cherry on top, so use it to your advantage to properly direct your efforts and energy.
Web analytics
Web analytics is the process of measuring, collecting, analysing and preparing data from the web in order to understand user behaviour, to optimise websites, and to take full advantage of online advertising campaigns.
Two categories of web analytics
Using web analytics, we measure visits to a particular website and thus see what users are interested in and what they are not. With the knowledge and insights gained, we can improve a website and make it more user-friendly (and increase conversions).
1. Off-site web analytics primarily involves measuring the behaviour of potential customers, the visibility of your company on the Internet, and links to your website.
2. On-site web analytics measures the behaviour of users when they are already on your website. We can see what users were doing on the site and how long they stayed on it. With this information, we can improve the website or a specific campaign.
You need to be aware that no website or advertising campaign is so good that it can not be improved further. And web analytics provides the basic tools for analysing the situation and determining the course of corrections.
The basic analytics tool we use is Google Analytics, but we also use others, such as MOZ and Clicktale. Using these tools, we perform a detailed analysis of visits to your website and set the future strategy.
Five basic pillars of web analytics
1. Setting the goals
This is the most important step in analytics. If we do not know our goals, we can not know if they were achieved.
2. Key performance indicators (KPI)
These are indicators that help us measure progress on the path to our goal. By measuring these indicators, we get a more detailed insight into the operation of a particular campaign or website.
We know several types of KPIs:
- return on investment (ROI),
- increased sales,
- social interactions,
- traffic sources,
- price of advertising per contact/sale,
- conversion metrics,
- visualisation of the purchase channel,
- position of individual keywords on search engines.
We do not use all indicators simultaneously in every case, but determine the ones that are most important for an individual company or marketing campaign.
3. Data collection
When collecting data, we need to be careful to collect the right and accurate data, as well as to collect everything we need. Collecting incorrect data and/or selecting an insufficient amount can lead to misinterpretation and consequently an incorrect strategy setup.
4. Data analysis
Once we have the data collected and want to analyse it, we need to pay attention to several things:
no website can compare to another website,
“bounce rate” (meaning the percentage of users who visit the page but leave it before viewing any subpage) measures the quality of users who come to the website,
keywords used by those users who are on the website tells a lot about why they visited a particular page,
a search engine on a specific website shows what exactly the users search for on that websit.
Data analysis helps us improve a particular website because we know what users want and are looking for, it helps us detect errors and make the site more user-friendly.
5. Testing and implementing alternatives
After the analysis, we make a hypothesis on what corrections will results in improvements. Before making corrections, we need to test the hypothesis, because, while a certain thing may seem fine to us, it is definitely not good for the user. After the testing or hypothesis testing stage, we start the implementation.
With analytics, we must to be aware that this is a cyclical process that never really ends. Once we fix and improve a particular website, we need to start the analysis again.
Google Analytics is not some scary dragon! Even though it spew mountains of data
Google Analytics provides a lot of data that you probably don’t have the time to review. Once you implement Google Analytics on your website, we recommend you start by looking at and learning from the following metrics:
A) Traffic source
You are most certainly interested in how individuals find you. They can access your website from social networks, Google searches, possibly from sent e-mails, or they can enter the link of your website directly in their browser.
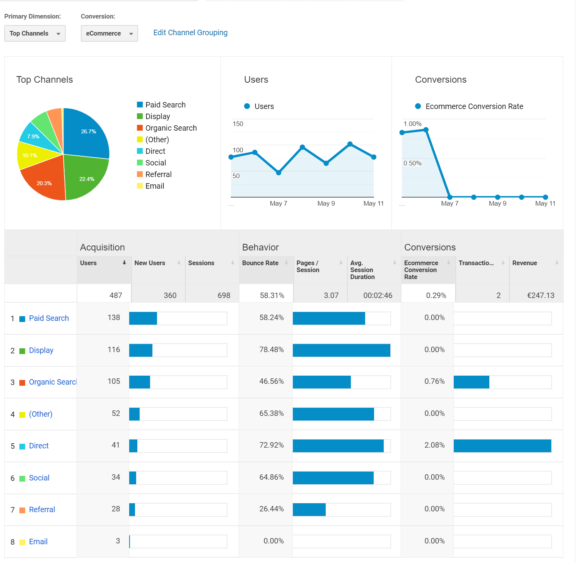
SET: Google Analytics – Acquisition – Overview
The plotted graph will show where and in what scope (%) individuals came to your site, how many people visit the site daily, where you generate the most traffic, etc. The data tells you if your marketing strategy works, because you want people to visit your website from different sources.
Organic Search – The individual accesses your website through a search engine (Google, Bing, etc.).
Paid Search – The individual accesses your website through a search engine, by clicking on an ad.
Display – The individual accesses your website through an ad banner.
Direct – The individual enters your URL into their browser and accesses your site directly.
Social – The individual accesses your site through social networks.
Referral – The individual accesses your site via a link on another website.
E-mail – The individual accesses your site via a link included in an e-mail.
B) Social media traffic
From which social network do you refer most users to your website?
SET: Acquisition – Social – Overview
You surely invest a lot of time and energy on activities of your social networks as well. It makes sense to monitor what brings the most users to your website, so that you can adjust the way you communicate on the network that generates the least traffic and on the network that generates the most traffic.
C) Time on page
It is not a good sign if an individual leaves your site immediately. You want the individual to read the content you post, research the page, and get the information that would convince them to buy or work with you. The longer they spend on your website, the better!
SET: Behaviour – Site Content – Landing Pages
D) Bounce rate
The bounce rate tells you how many people who visit your website leave it immediately, or what percentage of users have visited just one subpage. A high bounce rate is therefore not a good sign. You want this number to be as low as possible. If your bounce rate is above 70%, start thinking about a better website design and content.
SET: Behaviour – Site Content – Landing Pages – Bounce rate
E) New and returning visitors
You want to have just the right level of new and returning visitors on your website. If you are attempting to build an active community, you want to have a large number of returning visitors. However, if you are also conducting your marketing activities well, you will receive a large number of new visitors to the site, who can become returning visitors.
SET: Audience – Behaviour – New vs Returning
Facebook analytics
We could say that a company does not even exist today if it does not have its own Facebook page. Facebook analytics will provide you with a lot of high-quality data to help you track and measure the results of your Facebook activities. As part of its analytics, Facebook offers a large amount of information, which is available to you free of charge. However, you can also use any of the paid tools (Sprout Social, Social Bakers, Amplifr, Hootsuite Analytics, etc.).
You can access page analytics and audience analytics directly from your Facebook page.
Facebook Page Analytics offers a detailed insight into your Facebook page: you can find out what works and what does not, how your followers interact with your page, and how to improve your results.
Facebook Audience Insights helps you understand your audience, so you can better design content and targeted ads.
Facebook Page Analytics
You can access Facebook Page Analytics of by clicking “Insights” on your Facebook page.
![]()
The Overview page opens up:
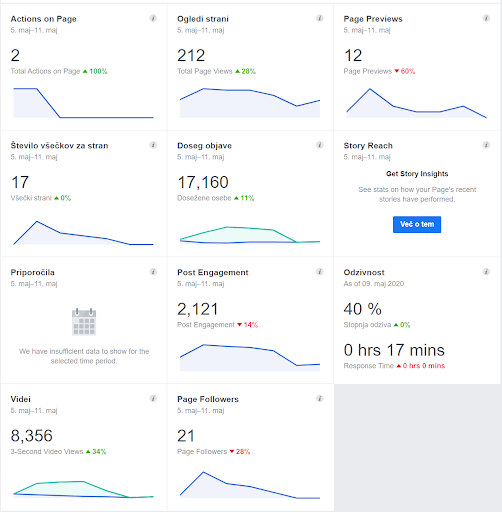
Here you can quickly check the basics metrics that tell you what is happening on your Facebook page. You can also specify the time frame you are interested in.
Actions on Page – Shows you the number of clicks on your contact information and the call-to-action button.
Page Views – Shows you the number of views of your Facebook page in a given time frame.
Page Previews – Shows you the number of individuals who hovered over your page information to see the page preview.
Page Likes – The number of new page likes in a given time frame.
Post Reach – The number of people who saw your post on their timeline in a given time frame.
Story Reach – The number of people who saw your story in a given time frame.
Recommendations – The number of people who recommended your page in a given time frame.
Post Engagement – The total number of likes, comments, shares, etc. your page got in a given time frame.
Responsiveness – An approximate estimate of how often and how quickly you respond to received messages.
Videos – The number of 3-second or longer video views in a given time frame.
Page Followers – The number of new followers in a given time frame.
Clicking on a box will show you a more detailed analysis of the selected metric. Below the boxes listed is a list of recent posts where you can compare the reach and responsiveness of your followers in one place. Under recent posts, Facebook gives you the option to add pages whose activity you want to monitor. Here, you can list competing pages or pages that motivate you to do better.
When you review general analytics, you can also take a closer look at data such as likes, reach, posts, page views… You can access this data in the left column under “Insights”.
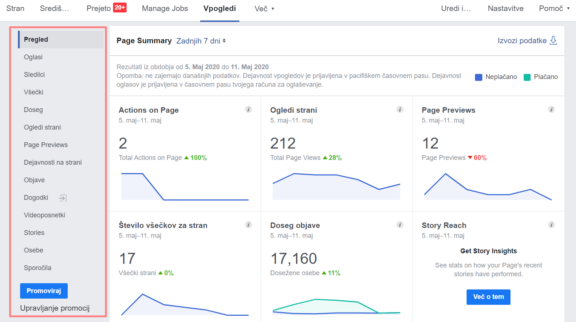
We recommend that you view the information under the “Posts” tab. Here, you can find information on when your followers are on Facebook and use those hours to post, see which types of posts achieve maximum engagement of your followers, and the competing pages Facebook recommends you follow.
Instagram analytics
Instagram has certainly become one of the more popular social networks, gaining in popularity even among the elderly population. To best adapt to an increasingly demanding audience, it is a good idea to regularly review analytics. The mobile application provides free access.
To get started, you need to switch your profile to “business”. You can then access analytical data under each individual post and via the “hamburger” menu in the upper right corner. Click on “View insights” for a specific post on the timeline. You can access “Insights” via the “hamburger” menu. You can monitor content, activity and follower behaviour metrics.
It is also interesting to monitor the metrics under the “hamburger” menu – Content – Posts – See All. Here, you can adjust the time frame, type of posts, and chosen interactions. Based on the latter, you can find out which types of posts reached the most individuals, which photo received the most likes, shares, comments, etc.
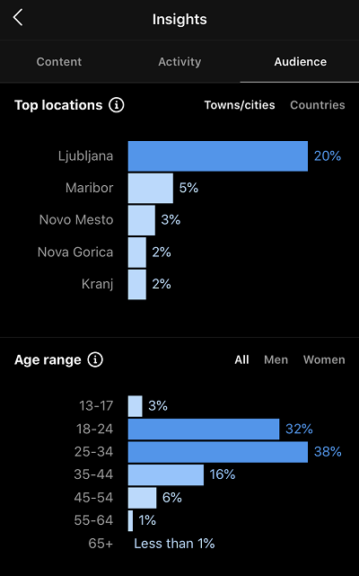

Analytical tools, whether free or paid, allow you to better understand the wishes and needs of your followers and thus better adapt to them. The more you know about your followers, the better your marketing campaigns will be.
“It is interesting to test oneself in different fields, as each new experience broadens the horizons. However, if you have a business and are tempted to use social networks for marketing purposes, entrust this work to someone with the knowledge and experience necessary. Call (070 773 850) or write (info@ideaz.si) to us and see for yourself – we are the right developer for you.”